


-
- Trading Platforms
- PU Prime App
- MetaTrader 5
- MetaTrader 4
- PU Copy Trading
- Web Trader
- PU Social
-
- Trading Conditions
- Account Types
- Spreads, Costs & Swaps
- Deposits & Withdrawals
- Fee & Charges
- Trading Hours


EN
1 July 2025,07:07
Daily Market Analysis
1 July 2025, 07:07


Key Takeaways:
*Wall Street’s bullish sentiment sent the Nasdaq and S&P 500 to an all-time high.
*High PCE readings from last week have drawn market concern about a more Hawkish Fed ahead.
*Market bullish momentum remains solid, but cautious of profit-taking sentiment.
Market Summary:
The U.S. equity markets extended their record-breaking run last week, buoyed by easing geopolitical tensions and a resurgence of risk appetite across global markets. The S&P 500 and Nasdaq Composite both closed at fresh all-time highs, while the Dow Jones Industrial Average played catch-up with a solid 1% gain, signaling broad-based participation in the rally. This bullish momentum coincided with a notable retreat in traditional safe-haven assets, as gold prices extended their decline and the U.S. dollar weakened further—clear indications that investors were rotating capital out of defensive positions and into risk assets.
Beneath the surface of this market exuberance, however, lurk growing concerns about the Federal Reserve’s policy path. Last week’s economic data presented a mixed picture that could complicate the central bank’s decision-making process. While Thursday’s stronger-than-expected GDP reading painted a reassuring portrait of economic resilience, Friday’s elevated PCE inflation print served as a sobering reminder that price pressures remain stubbornly persistent. This tension between robust growth and sticky inflation has left market participants anxiously awaiting guidance from Fed Chair Jerome Powell in his upcoming speech, which could provide crucial clues about whether the central bank might maintain its restrictive stance for longer than currently anticipated.
The current market environment presents a fascinating paradox. On one hand, the resolution of immediate geopolitical risks has removed a significant overhang from investor sentiment, creating fertile ground for further equity gains. On the other hand, the specter of prolonged higher interest rates looms large, potentially capping the market’s upside potential. This delicate balance suggests that while the path of least resistance remains upward in the near term, investors would be wise to brace for potential volatility as the market digests incoming economic data and central bank communications. The coming days will prove critical in determining whether this rally has staying power or whether it will succumb to the gravitational pull of monetary policy constraints.
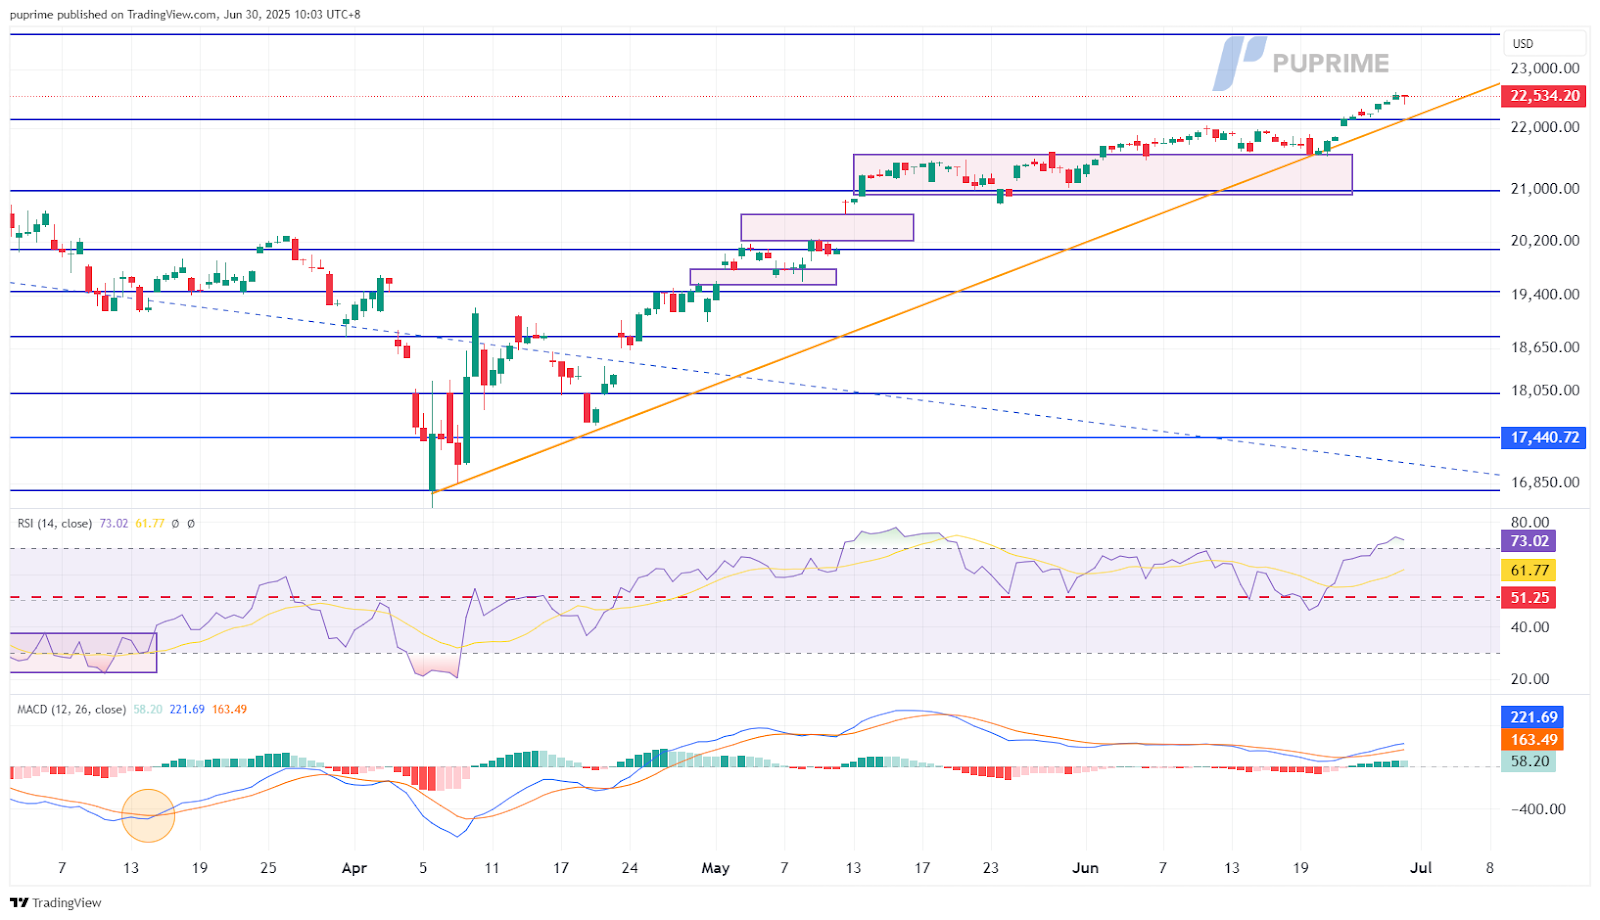
The Nasdaq Composite has surged with remarkable momentum, posting its strongest weekly gain since April as the tech-heavy index climbed more than 4% and closed at yet another all-time high on Friday. This impressive performance underscores the market’s bullish conviction. The index’s steady ascent reflects underlying strength, though its rapid rise now brings it into overbought conditions that historically precede periods of consolidation or mild pullbacks. While the bullish trend remains firmly intact, technical indicators suggest the rally may be approaching a near-term inflection point. The Relative Strength Index (RSI), though holding comfortably above its midline—a sign of sustained upward momentum—has crept toward overbought levels, hinting that the pace of gains may slow in the coming sessions. Similarly, the Moving Average Convergence Divergence (MACD) continues to signal bullish momentum as it rebounds above the zero line, but its trajectory shows early signs of flattening, which often precedes either a sideways drift or a modest retracement.
The Nasdaq’s breakout to uncharted territory leaves it without clear overhead resistance, opening the door for further upside, particularly if market sentiment remains favorable. However, the absence of meaningful consolidation since its mid-April lows increases the likelihood of profit-taking as traders lock in gains. Historically, such strong weekly advances have been followed by either brief periods of sideways trading to relieve overbought pressure or shallow pullbacks that test newly established support levels before the uptrend resumes.
Resistance levels: 22,890.00, 23,600.00
Support levels: 22,145.00, 21,000.00

Trade forex, indices, metal, and more at industry-low spreads and lightning-fast execution.
Sign up for a PU Prime Live Account with our hassle-free process.
Effortlessly fund your account with a wide range of channels and accepted currencies.
Access hundreds of instruments under market-leading trading conditions.
Trading Platforms
Learn
About PU Prime
Corporate